 back to
contents
back to
contents
"Light Makes Right"
November 8, 2008
Volume 21, Number 1
Compiled by Eric Haines, Autodesk, 10 Brown Road, Ithaca, NY 14850 erich@acm.org. Opinions expressed are mine, not Autodesk's.
All contents are copyright (c) 2007,2008, all rights reserved by the individual authors
Subscription: http://groups.google.com/group/ray-tracing-news
Archive location:
http://www.acm.org/tog/resources/RTNews/html/
(text version at
http://www.acm.org/tog/resources/RTNews/text/)
You may also want to check out the Ray Tracing News issue guide, the index to the Ray Tracing News, and the (ancient) ray tracing FAQ.
This has been a busy year for me. We finished a 3rd edition of "Real-Time Rendering" - now with 50% more ray tracing. Well, not really; the focus is still rasterization. Part of the new edition work was revamping the website. One good thing that came out of this was starting a blog: http://www.realtimerendering.com/blog. I've thought of having a blog for my thoughts on ray tracing and just do away with the RT News, but for now the format of a digest works fine for what I want to do. Namely, record interesting bits of information that might still be useful a few years down the road. A blog's better for rasterization, which continues to rapidly evolve due to qualitative changes in the GPUs. Well, true too for GPU ray tracers, but I don't have as strong an interest in this area (other than to admire others' work).
I spent a fair bit of my free time during the summer prepping for a keynote, "Ray Tracing: Strengths and Opportunities", at the IRT 2008 symposium, http://www.sci.utah.edu/rt08/. The talk can be found here: http://erich.realtimerendering.com/, but won't be half as good without the jokes, and won't make a lot of sense without more notes. I talk more about this problem of "here are the slides for my talk" at: http://www.realtimerendering.com/blog/rt08-presentation/. The gist is that most slidesets today are too wordy for the presentation itself, but not wordy enough for those who missed the talk but download the slideset later.
My talk's probably most significant for showing the dangers of ray tracing; see the slides near the very end. Chris Wyman tells me the same thing happened to him, burning a mark in a table. But wait, there's more! Here's an incredibly silly thing, with phat beats: http://animoto.com/play/ISVnBQw7k1EN1aG9uovIXQ - I do like that the service autogenerated this presentation. You can do this with any of your own works.
IRT 2008 itself was entirely great. You can find links for the papers at http://kesen.huang.googlepages.com/rt2008Papers.htm (previous conferences here: http://kesen.huang.googlepages.com/). Michael McCool led off with his keynote, which had some solid technical content, including a scheme where you map your objects to a Hilbert curve, sort by this order, then "read off" a BVH from the sorted list. I hadn't seen this idea applied to ray tracing before.
One general theme of the conference was using SIMD and/or packets effectively, the Surface Area Heuristic (SAH) was everywhere, and animated objects created interesting challenges for fast intersection. I was happy to see work on improving the efficiency of various types of hierarchies. I'll talk more about BVH later in this issue. One nice non-BVH result was Thiago Ize et alia's BSP work, in which using a BSP tree where the planes can be freely oriented was found to be more efficient for rendering. The hard part, of course, is forming such a hierarchy, but if you're allowed lots of precompute time then it's impressively effective. This issue's "Two New Ways" article touches on two other papers presented. Lagae and Dutré had a poster (and CGF paper) on storing grid acceleration structures in various compact data structures: http://www.cs.kuleuven.be/~ares/. There was plenty of other interesting work, and it's great to see this burst of new research in various ray-tracing-related fields (see Pete's article for some interesting stats in this regard).
SIGGRAPH 2008 was hopping, as usual, though having IRT just before it made for a long week. The coolest ray tracing related thing I saw was the CUDA ray tracer by NVIDIA; see the article in this issue. Quick news summary here: http://hothardware.com/News/NVIDIA-Shows-Interactive-Ray-Tracing-on-GPUs/. It was cool to see this running on the show floor, zooming along. Other ray tracing bits at SIGGRAPH are listed here: http://www.realtimerendering.com/wiki/wikka.php?wakka=RTNewsSIGGRAPH2008.
There's been an incredible amount of "ray tracing vs. rasterization" talk over the past year. Rather than being a real argument, I believe this sort of discussion reflects a yearning to be able to perform "unrestricted" programming again (not limited by simplistic data structures in the form of a few buffers). I was collecting these in anticipation of my talk. Phil Taylor has a good summary of some other articles here: http://www.futuregpu.org/2008/10/brief-history-of-recent-hw-ray-tracing.html. These are what I found:
You can also find lots of interactive ray tracing demos on YouTube. Here are a few:
There are other odd bits out in the datasphere. Witness JulesWorld, http://www.tgdaily.com/content/view/38145/135/, which had hype galore, some cool YouTube videos (see http://www.tomshardware.com/news/amd-ray-tracing-otoy-youtube,5826.html), but that my AMD contacts didn't really know about (despite their company being being a partner) and that wasn't present at SIGGRAPH.
Finally, it's been interesting to watch "acquisitions as ways to hire people" in the rendering world this past year or so: Neoptica acquired by Intel and put to work on Larrabee, RayScale bought by NVIDIA. There have been larger acquisitions, too: Opticore bought by Autodesk in June 2007, mental images became a wholly-owned subsidiary of NVIDIA in Dec. 2007, and Autodesk buying SoftImage just a few days ago (youtube video making the rounds: http://www.youtube.com/watch?v=kR7UWImpG54). I'm sure there are others that haven't shown up on my radar - feel free to clue me in.
back to
contents
____
To show how incredibly long it's been since the last issue: There's a worthwhile "State of the Art in Ray Tracing Animated Scenes" report at http://www.sci.utah.edu/~wald/Publications/
____
Last year during RT07 I more or less promised to provide the research community with some student art to use in RTRT research. Well, I finally have some stuff to share: My students released 'Outbound', a Myst-like game based on Arauna, which uses a ~1M polygon scene, completely hand-made, and built to demonstrate ray tracing. The data is available from my site (http://igad.nhtv.nl/~bikker) and comes with original textures and scenery data in several file formats.
In the meantime, a second team is working on a very interesting game right now, also based on Arauna. This game is an action game, and they strive for higher FPS. The art they are building is low-poly (~50k per room, optimized for ray tracing performance). It will be released somewhere after RT08 (again including full set of art).
- Jacco Bikker (Bikker(dot)J(at)nhtv(dot)nl)
____
Pete Shirley has a blog. Read it! http://psgraphics.blogspot.com/
____
I released a stand-alone kd-tree compiler, with a text file as output. I believe it builds trees of good quality, so if you ever feel like writing a tracer but hate to wade through Havran's NlogN paper for a good kd-tree builder, use mine instead.
Details at http://ompf.org/forum/viewtopic.php?t=438
This tool was initially created for Daniel Reiter Horn, for his GPU-based ray tracer. I asked him to test his tracer with exactly the input data I use.
- Jacco Bikker (Bikker(dot)J(at)nhtv(dot)nl)
____
Christer Ericson has two relevant blog entries:, Pluecker Coordinates Considered Harmful, http://realtimecollisiondetection.net/blog/?p=13, and the Scalar Triple Product, http://realtimecollisiondetection.net/blog/?p=69. Christer's more interested in collision detection, but the posts are worthwhile, in that they offer a way to avoid using less-than-intuitive Pluecker coordinates.
____
Matt Pharr notes that http://ompf.org/forum/viewforum.php?f=12, run by Thierry Berger-Perrin, is a pretty clueful forum on things ray tracing. I also like the 100-line sphereflake ray tracer: http://ompf.org/ray/sphereflake/.
____
Speaking of Matt, here are some nice images (by others, using Matt & Greg's system), in case you haven't seen them before: http://www.pbrt.org/gallery.php. The second one down (metal buddha) and the very last one (ceramic dragon) are magnificent.
____
I've been wrapping my head around Intel's Threading Building Blocks (TBB). I've seen a number of researchers mention using these in their ray tracing systems, and I've been impressed by how useful TBB can be for rasterization, too. Page here: http://www.intel.com/cd/software/products/asmo-na/eng/294797.htm - there's a typo, it should be "Tachyon", and the "2D ray tracer" refers to its 2-D image space parallel work decomposition scheme. TBB home page is http://www.threadingbuildingblocks.org/
____
A classic way to teach rendering is to have the students build their own ray tracer during the semester. Jason Waltman's project site, http://www.jasonwaltman.com/graphics/raytracing.html, is a nice example of what can be done by one student. I found it useful for example images of various effects: soft reflections, depth of field, motion blur, etc.
____
An impressive tutorial, one you may not have seen, chock-full of spatial-related acceleration techniques for ray tracing and rasterization, by Vlastimil Havran and Jiri Bittner: "Efficient Sorting and Searching in Rendering Algorithms", http://www.cgg.cvut.cz/members/havran/eg2006tut/tut4eg06.pdf
____
An extensive interview (sound, not words) with the POV-Ray guys: http://twit.tv/floss24?p=1
____
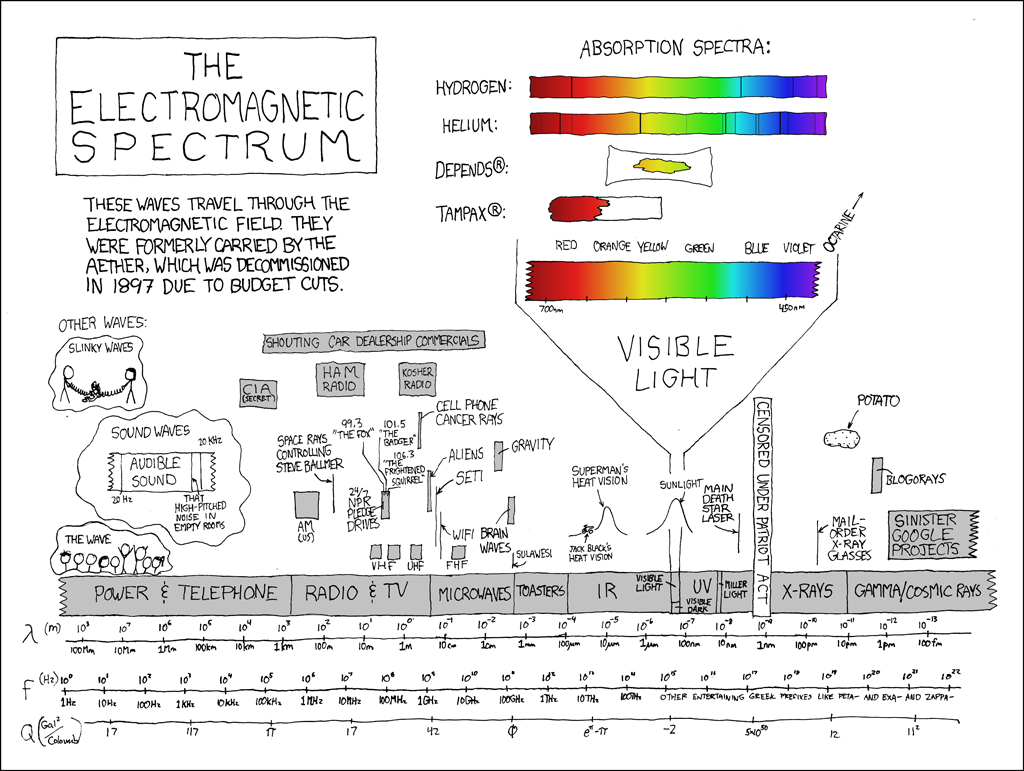
xkcd is, of course, wonderful at times. Like this: http://imgs.xkcd.com/comics/electromagnetic_spectrum.png
____
You may have seen the book "Hacker's Delight" - I inherited a copy of it from a student last year, and it's been a bathroom book ever since. It's a collection of bit-twiddling techniques, each one having its own strange beauty. Matt Pharr pointed me to a related work, the FXT book. This is a free, perpetually-updated collection of algorithms for programmers. It's up to 974 pages right now, starting with bit wizardry and moving through topics I've never even heard of. Take a peek sometime to feel humbled by how little you actually know: http://jjj.de/fxt/fxtpage.html#fxtbook
____
An impressive minimal POV-Ray image contest: scene files could have no more than 512 characters, http://local.wasp.uwa.edu.au/~pbourke/exhibition/scc5/final.html.
____
Morgan McGuire passed on the following: http://www.spl.org/images/slideshow/slideshow.asp?index=12 - just look at the banding artifacts and obvious quadratic patches in that...photograph. It's amazing what reality can get away with that we're not allowed.
In the "photo that looks like a rendering" category is this amazing thing: http://gizmodo.com/5038788/tallest-skyscraper-in-the-world-almost-completed-defies-belief, another shot here http://gizmodo.com/5039300/real-sim-city-comes-to-life-in-the-desert
____
A different sort of spatial query, the buckytree: http://www.mcnett.org/. One thing that wasn't clear to me was that at each level you re-evaluate which axis has the largest spread. Anyway, it's a different, sort-of slabs-based way to think of subdivision.
____
Visual tidbits:
"Processing" is a programming language for creating cool imagery. Andrew Glassner tells me it's incredibly fun: http://processing.org/
Graphical fun: grow a tree - http://www.gskinner.com/blog/assets/InteractiveElm.html
Patterns of reflection: http://patternsofreflection.com/
____
There was a fair bit of feedback about float to long conversion and its cost (see the last entry in RTNv20n1, Ray Tracing Roundup). Summary: ICC is fastest, gcc is also up there, Microsoft's compiler is last.
A related tidbit: http://www.ddj.com/184405848 - this is the third of three articles on optimizing a CPU-side rasterizer. It has some fascinating insights into what is fast and slow on the CPU. My favorite bit is where, due the cost of branch misprediction, a binary search is actually slower than brute force for less than 64 items. If you want to read the whole thing, part I is here: http://www.ddj.com/architect/184405765, part II is here: http://www.ddj.com/184405807.
____
If you're not entirely weary of Mandelbrot sets and similar, there are some quite nice renderings here: http://www.fractalartcontests.com/2007/winners.php
I like the concept of seeing the Buddha in the Mandelbrot set: http://en.wikipedia.org/wiki/Buddhabrot. Look hard enough in the crevices of this set and you can probably see anything; I suspect this will one day be the tea-leaf reading of the 21st century.
____
I'm not quite sure what to make of this raytracing something, but here goes: http://theamusementmachine.net/
____
Useful for putting together a lecture, if you need some free-to-reuse images in a hurry (including some ray traces): http://commons.wikimedia.org/wiki/Category:Computer_graphics
____
I swear the Wavefront OBJ file format will never die. If you want a 77 Meg file of a Mars rover model, here's where to go: http://cave-wiki.dri.edu/~coming/rover/mars_exploration_rover_scene/
____
I just love this picture, it's a sign that someone is living out his dream: http://www.schrankmonster.de/PermaLink,guid,0bb95d2e-4bbb-4658-a5bf-7f8b8141b7d7.aspx
____
Octave should be mentioned: it's a free Matlab clone (Matlab being a good language for signal processing and lots of other engineering tasks). http://www.gnu.org/software/octave/.
____
Why are stop signs red, etc.: http://www.colourlovers.com/blog/2007/05/01/11-great-color-legends/ - I like that pink used to be for boys, blue for girls.
On an unrelated note, parking signs comprehensible from only certain directions: http://de-war.de/eurekacarpark.html
Which reminds me of cities, and this incredible building: http://www.neatorama.com/2007/12/04/dexia-tower-in-brussels-38-floor-150000-leds-one-awesome-building/
Which reminds me of the country, and using grass to capture photographs: http://www.viewingspace.com/genetics_culture/pages_genetics_culture/gc_w02/gc_w02_ackroyd_harvey.htm
____
Yes, the iPhone now has a ray tracer: http://appshopper.com/productivity/itracer-lite, comments here: http://forums.macrumors.com/showthread.php?t=553158. I like the person who renders scenes while his girlfriend is trying on dresses.
____
A nice gift for a young child, the book "Gallop" has a number of clever illusions using this mechanism: http://www.sitepoint.com/article/css-animation-technique/
A new theory to explain some optical illusions: http://www.livescience.com/strangenews/080602-foresee-future.html
____
At long last, the perfect computer graphics shrine, but now torn down: http://www.telegraph.co.uk/news/worldnews/1495374/Bulldozers-tear-down-giant-religious-teapot.html and a worshipper imprisoned: http://www.telegraph.co.uk/news/worldnews/1580705/Woman-jailed-for-'worshipping-tea-pot'.html. Luckily the real teapot is safe in California: http://design.osu.edu/carlson/history/lesson20.html#melitta (I love that they made the synthetic model 30horter and squatter in order to compensate for non-square pixels - great plan...)
____
From John Peterson:
Sir Arthur Clarke's passing reminds me of this quote from "Childhood's End":
"...it was the art of the cartoon film, with its limitless possibilities, that New Athens had made its most successful experiments. The hundred years since the time of Disney had still left much undone in this most flexible of all mediums. On the purely realistic side, results could be produced indistinguishable from actual photography..."
It was published in 1953, nearly half a century before the dinosaurs of Jurassic Park.
[Magically enough, I was able to use Amazon's "Look inside" feature to verify this quote. The passage continues "...indistinguishable from actual photography--much to the contempt of those who were developing the cartoon along abstract lines." -- Eric]
back to
contents
A chance for a sphere to get hit by a plane is directly proportional to its diameter. The "mean width" for a sphere is the same for all orientations of the plane, and a sphere twice as wide is twice as likely to be hit.
I also gave, as background, the formula for the relative probability of plane and box. It turns out that simply summing the dimensions of the box is its relative probability of being hit. So a box that is 1x1x1 has a relative probability of 3, one that is 2x4x6 gives 12, so is four times more likely to be hit by a random plane. A surprising (to me) result, but this is a given.
So, what is the probability of a sphere relative to a box vs. the random plane? This question can be solved by determining the true mean width of the box. That is, if you randomly oriented the cube a zillion times and measured how much of a fixed axis each covered when projected on it, i.e., what the furthest extents were along that axis for each orientation, the average of these measures would be the mean width with respect to the sphere's measure of mean width.
It's clear that a sphere contained by a box must have a lower mean-width, so a sphere of diameter 1, fitting in a cubic box of 1x1x1, has a lower chance of being hit. A sphere encompassing the cubic box must have a higher chance, i.e., one with a diameter of sqrt(3) vs. the box's 1x1x1 as a probability. So the sphere to box conversion ratio must be between 1.0 and 1.732. That is, some sphere of diameter between 1 and 1.732 must have the same chance of getting hit as a box of size 1x1x1. To beat this to death, this is the same as saying that the mean width of the 1x1x1 box must be in this range. At first I tried directly working on what the average width is for this cube, but it was a bit tricky to feel confident I was catching the full projection of all orientations.
So I took a different approach. The first insight helped simplify the problem. Instead of a 1x1x1 box, consider a 1x0x0 box, essentially a needle. The relative chance of a plane hitting this needle is 1+0+0 = 1, vs. the cubic box's 1+1+1 = 3 chance. If the needle is perpendicular to the plane, its mean width is 1.0; if parallel, 0.0. The main question is then, what is the mean width of this needle when arbitrarily oriented? Centering the needle on the origin and then arbitrarily orienting this needle forms a sphere of points from the needle's endpoints; this operation is equivalent to holding the needle still and changing the orientation of the plane randomly. All points are equally likely on the sphere, since all orientations have the same chance. What we now want to know is what is the average Z height of the set of endpoints; in other words, what is the average height above the plane of the set of points on a hemisphere? This will equal half the mean width of the needle.
Imagine you take a sphere and encompass it with a tight-fitting cylinder, its height equal to the diameter. The surface area of the cylinder and sphere are the same, 4*pi*r^2. With the cylinder being vertical, it turns out that if you slice the cylinder and sphere at any height with a horizontal plane, the surface area of the part of the sphere above the plane is equal to that of the cylinder above the plane (and, of course, both parts' areas below also match). Archimedes proved this (way before calculus) and the fact so delighted and amazed him that he had a sphere and cylinder put on his tombstone. See http://www.mathpages.com/HOME/kmath343.htm for more information.
How does this apply? The surface area of any slice of the sphere is equal to any other slice of the same thickness. For example, a slice for heights [0.2,0.3] has the same surface area as from [0.83,0.93]. Once you accept that the sphere and cylinder are equivalent in this way, along the axis of the cylinder, you notice that the density of points on the sphere as a function of height is a constant number, since the cylinder's area is obviously constant with height. The answer is then clear: the average height (above the origin) of a cylinder on a plane is half the height of the cylinder, which therefore is the average height of a point on a (hemi)sphere. I'm sure you could write a double integral to prove this (and I'm sure I could do this back in 12th grade), but I like that you don't really need to do so.
Now we have all the pieces. A needle of length of 1 has a mean width of 0.5, compared to a sphere having a mean width of 1.0. The box 1x1x1 is 3 times more likely to be hit by a random plane than the needle, so it must have, compared to the sphere of diameter 1.0, a mean width of 1.5. So the final answer is that a box of DxWxH has a mean width of (DxWxH)/2 compared to a sphere's mean width of 2*Radius. Simple, but I couldn't find this written down anywhere in the Discrete Differential Geometry material I could find, nor could I find anyone in the field who knew the answer. In fact, this writeup is a bit incorrect in terminology in terms of that field: in that field, the "mean width" of a 1x1x1 box is 3, the sum of the edges, when in fact the "geometric mean width", the width you would observe if you did measurements of the arbitrarily-oriented box, is half of that. However, "geometric mean width" is my own term - it's one that makes sense to me, but isn't used this way in the field.
back to
contents
back to
contents
Ray tracing has been an active area of computer graphics research for about three decades. While somewhat quiet in the 1990s, ray tracing has seen resurgence in the last few years. According to google's scholar database, Whitted's classic paper received more citations in 2007 than in any previous year. This is in spite of the decreasing likelihood of citations to Whitted's paper within modern ray tracing papers; only one in six of the papers in the 2008 Symposium on Interactive Ray Tracing (RT08) cited that paper. In response to this renewed interest I presented a poster at RT08 titled "A Proposal for Terminology Related to Ray Tracing". This was a reaction to all the scar tissue I developed over terminology in global illumination where we too late got our act together as a community in getting a sensible and consistent set of terms. Even now, there is no standard definition for what a "radiosity" method is. I would include a photon-tracer that writes irradiances to texture, while some others would assume any radiosity program uses a finite element method. As ray tracing is now making a comeback, I'd like to build some consensus on terms to lower confusion as we discuss ray tracing. I include an edited version of the poster abstract here, along with some outstanding issues I hope people will weigh in on. I considered forming an ad hoc working group, but decided maximizing latency was a bad idea given the current popularity of ray tracing.
DEPRECATED TERMS
The following terms should be avoided:
Secondary Ray. Some authors include shadow rays in the definition of secondary rays. Others exclude shadow rays. The common use of "primary" and "secondary" do not suggest a resolution of this ambiguity.
Primary Ray. One might assume that a ray that is not "secondary" is "primary". However, authors that do not call shadow rays secondary do not typically consider them primary either. Given that and the ambiguity in "secondary", "primary" should be deprecated. Some people at RT08 argued that "non-viewing" rays should have its own name. On further thought I disagree with that, as non-viewing rays vary so much among themselves in both what they are used for as well as their computational characteristics.
Global Illumination. For a decade "global illumination" was meant to include any method in a shader that used more information than the shaded point's and luminaire's data. Thus any method that included shadows was a global illumination algorithm. Whitted's paper was called a "global illumination method" by most 1980s authors. However, in the late 1980s some started to use "global illumination" to imply some diffuse interreflection. That latter usage is probably more common now. However, it is a poor term in that it leaves a gap between "local illumination" methods that is still used as it was in the early 1980s, and "global illumination" methods. Under the usage that includes diffuse interreflection, Whitted's or Cook's methods would be neither local nor global. That being said, "global illumination" is to be preferred over "radiosity", which some game developers use to mean any method that computes interreflection.
The Ray Tracing Algorithm. Whitted's original paper said it was "a ray tracing algorithm" and discussed previous ray tracing algorithms that did not include specular reflections and refractions. As his method became popular there were no competitors and many authors began to refer to Whitted's algorithm as THE ray tracing algorithm. Subsequent algorithms such as distribution ray tracing clouded the usage.
Ray Segment. I first saw this term in Jim Hurley's writing on ray tracing. I used the term for several years as I thought it made clear I was talking about a single ray and not a ray tree. However, under similar logic one should explicitly say "ray tree". So what is a "ray"? I think we should as a community reclaim the term "ray" to mean a single half-line. This will require some discipline on our part, but the problem Jim's usage addressed should fade if we have it.
SUGGESTED TERMS
Occlusion/Visibility. These are two opposing terms that are used inconsistently in the literature. Either can be a boolean, scalar, or color depending on context, and no specific aspect of that context should be assumed when describing an operation using those terms. Most functions in programs compute visibility (true = 1 = fully visible) in practice even when they use opacity to describe them.
Ray Packet. This is a set of rays that are processed that the same time. The term "ray bundle" is also often used. Packet is to be preferred only because its use is somewhat more common.
Viewing/Camera Rays. These are rays from the pinhole/eye or lens area and traced into the scene. This term has the advantage of sounding like the viewing calculation in GPU graphics.
Radiance Rays. These return a radiance value (i.e., a color rather than a fractional occlusion/visibility). Viewing, reflection, and refraction rays are radiance rays while shadow and ambient occlusion rays are not.
Shadow Rays. These return an occlusion value for a point to be shaded from a light. Without further modifiers, it should not be assumed which of a boolean, scalar, or color value it computes.
Occlusion Rays. A more general from of shadow rays in that they are sent to directions that may or may not include lights. Occlusion rays may return booleans or may return some fraction. The distinction between "shadow" and "occlusion" rays may be a bad one, as it is not clear which term is better for sampling an HDR environment map. If one term must be chosen I would suggest "occlusion ray" to encompass shadow rays.
Specular Reflection Ray. A ray that is reflected from a mirror-like surface. There is some ambiguity on whether there is any randomness allowed in direction. This ambiguity can be mitigated by using the expanded terms "ideal specular reflection ray" and "glossy specular reflection ray" when needed, in context. Because the short-hand "reflection ray" is sometimes used to include diffuse as well as specular rays, it should be used only when its meaning is clear from context.
Distribution Ray Tracing. A method that allows viewing, reflection, refraction, and shadow rays to be randomly perturbed to implicitly sample integrals as described by Cook. Sometimes called "Cook ray tracing" or "Distributed ray tracing", with the latter term to be avoided. Heckbert was the original advocate of replacing "distributed" with "distribution" to avoid confusion with parallel (distributed) computing, and this suggestion has been adopted in many papers.
Path Tracing. Differs from Distribution Ray Tracing in that random rays are traced from diffuse surfaces as well as imperfect mirrors. Also called "Kajiya ray tracing" or "Monte Carlo path tracing".
Binary Space Partitioning (BSP) Tree. This term is often used in ray tracing to refer to kd-trees or particular variants of kd-trees. However, most of the graphics communities assume that potentially non-axis-aligned dividing planes are allowed in a BSP tree. The conventional graphics term is preferable because we lack a term in ray tracing other than BSP trees to account for arbitrary dividing plane orientation. Ironically I think the origin of the ray tracing community's non-standard usage may stem from a paper I did with Kelvin Sung called "Ray tracing with the BSP tree", which used a k-d tree.
K-d Tree. This is a k-dimensional tree whose nodes divide along one of the Cartesian axes. In practice in ray tracing k=3.
Ambient Occlusion. This is the average cosine-weighted visibility of the background (usually the ambient occlusion is one if nothing is occluded and 0 if everything is). It is often visibility out to a point, and more generally with a function of distance decreasing from 1 to 0 rather than a boolean. In practice the ambient occlusion is often dampened by averaging it with a constant.
Gather. This is an average radiance of directional samples, usually but not always cosine-weighted samples. Unlike ambient occlusion, when a gather ray hits a surface some illumination model such as photon mapping is evaluated and a radiance rather than an occlusion value is returned. One suggestion is to call this a "gathering" to distinguish it from "scatter-gather". I think that might be a good idea.
Surface Area Heuristic (SAH). Goldsmith and Salmon introduced a cost function to approximate the expected time to intersect a uniformly random ray with a set of primitives stored in a bounding volume hierarchy (BVH). They also introduced a greedy bottom-up construction algorithm which has since not been found to be competitive. MacDonald and Booth adapted that cost function to k-d trees and they called their cost function the "surface area heuristic". They also introduced a greedy top-down build which took each node in isolation and decided whether to subdivide it based on the unsubdivided SAH and the SAH of creating exactly two new leaves (ignoring the potential for further subdivisions). Since that time, BVHs have been shown to benefit from this top-down greedy build as well. Although not exactly consistent with McDonald and Booth's original paper, in practice both cost functions are called the SAH, and this has not led to much confusion because it is usually clear from context whether a k-d tree or BVH is being used. So it is recommended that this practice of letting the SAH encompass a family of cost functions continue. The top-down greedy algorithm should not be called the SAH; rather it is a particular empirical method to let the SAH drive tree construction.
back to
contents
I am a big fan of Hanan's works, his first books, "design..." and "applications..." were among the most thumbed books on my shelf. This new text replaces them both. It's worth noting that this is the tallest book on my shelf by more than an inch, which required me to raise the shelf, but also makes it easy to find!
Hanan's approach is an interesting one for the game and graphics community because he thinks of spatial data structures as indexes into a database, rather than thinking of them as native storage mechanisms. Among other advantages, this enables deployment of multiple SDS-based indexes on a single database, chosen for particular performance properties.
The Metric Data Structures book is definitely not designed for casual reading! I like to treat it like an encyclopedia. It is so comprehensive that it is my first source, but I need other resources to flesh out pragmatic details. Several passes at any topic in the book with a web browser by your side will often fill in the blanks. The companion examples on Hanan's web page are very helpful, as well.
I would like to see subsequent editions of this book include some of the pragmatic refinements that have been made in the fields of games and graphics, especially in areas of leveraging coherence from frame to frame.
I don't know if you know Hanan, but if you want to have some fun, talk to him about various spatial algorithms and the book. He's got a photographic memory, and can tell you the page number to refer to, who invented the algorithm, and about 5 things you wouldn't think he'd be able to recite about any algorithm in there. It blows me away!
back to
contents
The pick-up sticks case might better be visualized as a mesh, with each long wire as a separate object. The point here is that the first splitting plane made could form two child boxes that are almost identical in size to the parent box. A naive "sort by the centroids and divide the objects into two equal subsets" approach will certainly fail: assuming the wires are jiggled a bit (so that the centroids are not all perfectly aligned), then this approach would have the effect of putting half the horizontal and half the vertical wires in each child, so forming child boxes that are about the same size as the parent. By any local efficiency criterion, such children are doing nothing to improve efficiency.
A simple SAH scheme will not fare much better. Say you do a test of "try a split at each centroid and compute the efficiency", starting with the horizontal axis. You normally compute a running total of how many objects are to the left, right, and overlapping the test points, traversed left to right. All the horizontal sticks will overlap all test points. So the "best" centroid will split the set of sticks into about two equal sets, by this criteria, putting about half the vertical sticks in each child, along with some horizontal sticks in each. However, each child box formed is again about the same size as the original bounding box, gaining you little for a single split.
The room full of dice I probably should have called a room full of ping-pong balls at zero G's; I meant for the room to be full of small objects in 3D, uniformly distributed. I'll keep it "dice" just because "dice" is a shorter term than "ping-pong balls". For this case, the problem is that one of the child bounding boxes will be the same size as the parent bounding box (as it will include the room itself), yet will contain only half the dice (the other half being in the other child). At each successive cut, half the remaining dice will likely be put in one child box along with the room, and this will continue for a number of divisions. In fact, some top-down schemes work worse than that. For example, say you did a spatial median split strategy, where you take the bounding box, choose the longest axis, and split in half. One child will always include the room itself, of course. However, this child would then have to be split again in exactly the same way, choosing the longest axis and splitting in the same fashion, which would have no effect on this child (all objects would land on the same side of the split, ad infinitum). I think there's an interesting area for improvement, that if an object is intersected by the "best" plane and is larger than some value (e.g., some ratio of the child's surface area vs. the object's), it should immediately be separated out to its own box rather than be forced into a child.
Long and short, top down algorithms can have problems doing the right thing in some cases. If you were to form BVHs by hand, for the wires case you would certainly put all the horizontal wires together in one child and the vertical in the other; for dice you would separate the room from the dice and then subdivide on the dice. Current top-down algorithms forming BVHs tend to treat objects by their centroids and have little sense of grouping by size or shape.
Being an inveterate efficiency scheme guy, what most interested me at RT '08 were two papers: "Fast Agglomerative Clustering for Rendering", by Bruce Walter, Kavita Bala, Milind Kulkarni, and Keshav Pingali, and "Tree Rotations for Improving Bounding Volume Hierarchies", by Andrew Kensler. Both can be found at http://kesen.huang.googlepages.com/rt2008Papers.htm.
Bruce's (et alia's - I'm going to leave the "et al"s off from here on in) scheme is bottom-up. It's slower than most top-down methods, but it can be made pretty efficient. The basic idea is for each object to find, of all the other objects in the scene, that one which is its "best match". A best matching object for a given object is one that would minimize the intersection cost the most if the two objects were put in a tight bounding box. On an intuitive level, imagine the pick-up sticks case. Each vertical stick would note that its best object to pair with was another nearby stick, to the right or left of it, since putting two neighboring sticks in the same box would be a win. Same with the horizontal sticks, each points to the stick it pairs up with best. For example, imagine three vertical sticks:
A      B   C
|      |   |
|      |   |
|      |   |
|      |   |
|      |   |
Stick A would point to B, B would point to C, C to B, as the best matches. Since B points to C and C to B, these would form a good pair and be put in a parent box. This parent box may affect the graph, i.e. anything pointing at it may decide the resulting box is now too big to be a best match and so another match should be found. After each merge the graph is checked again and the best pair (objects that point to each other) are put in a parent box, the graph updated, and the process repeats. For our simple example the hierarchy would be:
      box
       |
    +-----+
    A    box
          |
        +---+
        B   C
A trivial example, but this has a pretty logical feel to it: nearby objects get paired up as best as possible, the results get folded back into pairing, and eventually you get a BVH. The paper gives a number of techniques to speed up the search for best matches. The results show the agglomerative method is generally superior to a top-down scheme: the theoretical expected cost of a random ray is up to 30 0.000000e+000ss, and actual timings (though not quite as good) also show up to a 30avings. The top-down scheme used is Wald's fast binning scheme from IRT'07, which is not really optimal (better is Wald's BVH scheme for their animation paper, which I'll briefly describe below). Still, the sense is that agglomerative BVH formation gives higher efficiency trees. For the pick-up sticks and dice room cases this algorithm should work pretty well. Certainly the vertical sticks will pair up with their neighbors, the horizontals with theirs, until each set is in a separate topmost box, with these two topmost boxes then getting bound into one root box. The dice will also pair with each other, until the sum of the dice then pairs with the room itself at the top of the tree.
I am sure local greediness causing inefficiencies, however. Imagine you have vertical sticks A B C D, left to right, at almost regular intervals. B and C happen to be slightly closer to each other than their neighbors, so they get paired first. Then A or D will get paired with BC's box, then the remaining single object (D or A) would get paired to this cluster of three. Better would be for A and B to pair up, C and D to pair up, then the two parent boxes pair up. This is a more balanced tree and will be more efficient. The greedy, localized nature of the algorithm gives a less optimal result in this case.
Kensler's paper gives a clever idea: after forming your bounding volume hierarchy using whatever method you like, try to do local swaps (tree rotations) that improve your overall theoretical average tree traversal cost. It's easiest to just look at figures 1 and 2 in the paper: http://www.cs.utah.edu/~aek/research/tree.pdf. Doing so, he gets at best a 10 0ecrease in cost after a number of iterations. More interesting yet, he uses simulated annealing to essentially first jumble the tree a fair bit (allowing locally-inefficient swaps) and get it out of a potentially local minimum, then iteratively apply effective rotations to a minimum, jumble a bit less, iterate, and so on. This gets a decrease as much as an 18 0ecrease in SAH theoretical cost (in terms of empirical results, most times improved but occasionally some test case would take longer - I can entirely empathize with this sort of thing, where the theoretical result improves but actual performance worsens).
I was happy to see someone using the idea of simulated annealing for this purpose. This idea was floated by Jim Arvo twenty years ago, in the second issue of the Ray Tracing News. Arvo thought in more general terms, where you could use entirely different efficiency schemes (grids, BVHs, octrees) at different parts of the hierarchy, varying these to find an optimal hierarchy of efficiency schemes. Kensler's approach is easier to imagine and control, and appears to give good results.
Though Kensler's results are not as strong as Walter's on the face of it (purely by statistics), Kensler starts with Wald et alia's more effective BVH scheme, from:
    I. Wald, S. Boulos, and P. Shirley. Ray Tracing Deformable Scenes using
    Dynamic Bounding Volume Hierarchies. ACM Transactions on Graphics,
    26(1):1–18, 2007.
This method is as follows: objects are sorted by centroid, with centroids essentially marking split locations. For forming BVHs there's no real splitting plane, you just separate the set into two sets and bound each, using these children bounding box areas to determine the effectiveness of the split. The (simplified) cost function is each child box's surface area times the number of objects in the box, summed together. However, if you were to check each pair of sets separately, you'd have to recompute the bounds for each set from scratch. The clever bit is to walk the list of objects backwards and compute a running bounding box for each object added, then run forwards through the same list and also compute a running bounding box. Then at any given split you have two bounding boxes (one stored from the backwards run, one computed on the fly from the forwards run) and can see how effective the split will be.
An example will make this clearer. Say you have five objects, A through E. You will test all three axes as follows: sort the objects by their centroid locations. Say the order for one axis is C E A D B. First traverse this list right to left. So, at B, you start with the bounding box for B and store its surface area for B. You visit D, adding it to the bounding box for B, and computing and storing the surface area for this object. You add A to the bounding box for DB, compute area and store for that location, all the way back to C. Now traversing left to right, you start with the bounding box for C and compute its surface area. The cost function, if you were to split the set into two sets {C} and {E,A,D,B}, would be 1*C's area plus 4*EADB's area. The "1" is for one child, C, the "4" for 4 children, EADB. By going right to left initially and storing the area of the accumulated right-side bounding box, you have the area for EADB stored. Moving to object E, you compute the running bounding box for CE, get its area, then compute 2*CE's area + 3*ADB's area. Again, ADB's area was computed by the right to left sweep and stored. In this way, you'll find an accurate "best" cost for the sorted list by just two passes through this list. It's only locally optimal, and only for that particular ordering of the list, but this scheme works better than an SAH-based splitting plane that essentially gives up on objects that are split by a plane test at each centroid by counting them as being in both boxes.
What is great about this scheme is that it actually does better with the pick-up sticks problem than other top-down methods. What it will do for this case is find the centroid where all the horizontal sticks are in one child (and most of the vertical sticks), and the other child has just the remainder of the vertical sticks (those to the far side of the centroids of the horizontal sticks). The child with the horizontal sticks will not be any smaller than the parent (or not much), but the child with just the vertical sticks will definitely be smaller and therefore effective. There is some waste, but at least the first split does something useful, vs. "just split it down the middle", which creates two children boxes the same size as the parent.
The room of dice doesn't perform better on the first split than a naive splitter - it turns out that splitting down the middle is what Wald's scheme would also likely give. For example, given a room full of dice ("*" are the dice):
   +----------+
   |**********|
   |**********|
   |**********|
   |**********|
   +----------+
After one split:
      child 1           child 2
   +----------+
   |*****     |          *****
   |*****     |          *****
   |*****     |          *****
   |*****     |          *****
   +----------+
there are two children, one with the room and half the dice, the other with the other half of the dice. All the top-down methods I know, simple or clever, will give something like this. When this half-full room on the left is divided by SAH splitting, all potential split planes hit the room, so its effect on the cost function is nullified. That means that basic SAH testing would split the dice in the left child into two sets, with the room again added to one of these sets. This halving process will go on quite awhile, with the room never being separated from some remaining dice, since the room itself is ignored by an pure SAH-split cost function.
What we'd really like is for the room to be removed entirely from further dice testing, the sooner the better. This is where Wald's scheme excels. Sorting child 1's objects on a horizontal axis will result in the room itself being the rightmost object, since its centroid is to the right of all the remaining dice. The optimal split will turn out to be just where you would want it: the resulting left subchild gets all the remaining dice, the right subchild gets the room. This happens because the room's bounding box is accounted for correctly in the cost function computations. After this second split the room has been removed from the dice and the pathological case is solved. It might have been nicer to first separate out the room entirely from all the dice at the first split, but Wald's scheme gets you there in two splits instead of one. Anyway, this scheme is the baseline that Andrew Kensler used for his research, and it seems like a pretty good starting spot (the best I currently know, at least).
I asked Andrew Kensler and Bruce Walter how they thought their schemes would handle these two potentially-nasty cases. My secret agenda was to have them collaborate on a paper, where Bruce would first form an agglomerative hierarchy, and Andrew would do simulated annealing on the result to see how much, if any, it would improve it further. Unfortunately, my nefarious puppetmaster skills haven't yielded any results yet, as far as I know. However, I did get interesting replies and a continued conversation with them both. Quite a bit was said, but I'll try to just sum up the high points.
First, Bruce believes his scheme would do pretty well with both pathological cases, which I also expect would be the case. Not optimally (as noted by the A B C D pick-up sticks problem earlier), but it would avoid the top of the tree being poorly formed, for the most part. Andrew, impressively enough, actually ran some tests. First, he found out that Wald's scheme worked pretty well in solving the pathologicals from the get-go, in the process making me go learn about Wald's scheme (it's buried in some pseudo-code in Wald's paper, not really described, which is one reason I explained it here). I had read through Wald's paper, but never spent time grokking the pseudo-code. Second, he found that his tree swapping scheme indeed worked as expected: the room for the room full of dice would indeed percolate up the bounding volume hierarchy until it stood alone by itself, near the root.
This being a text-and-ASCII-art kind of publication (it makes my life simple), I can't show you the cool visualizations he made of the test hierarchies, but they're a pretty nice way to visualize bounding boxes in a schematic tree, making the node radius log-proportional to the size of the box and using node color to show which axis (XYZ == RGB) of the box was the longest.
It's great to see serious progress these past few years on forming better BVHs. There's also been work (such as Wald's RT'07 paper, see http://kesen.huang.googlepages.com/rt2007Papers.htm) about how to form better BVHs rapidly, which is also quite useful. Me, I'd like to know how much more could be squeezed out of BVHs formed by these various methods. My guess is, not much, that we're pretty close to the optimal solution, at least optimal as judged by our efficiency equations. The next task is then to tune the efficiency equation, if possible, so that it better mirrors how well the hierarchy does in practice.
back to
contents
This exercise was a test of the software/hardware capabilities of current GPUs to deal with the irregular computational loads caused by ray tracing with programmable shaders. The results were good enough to indicate that the basic techniques could be used in current applications, and we're now working on getting these techniques into the field.
[For slides from their presentation (though these suffer a bit from the Powerpoint-without-notes problem I mentioned at the beginning of this issue): http://developer.nvidia.com/object/nvision08-IRT.html.]
back to
contents
I took out the swaps and unrolled the loops as you suggested, and did see an improvement of about 8%. Then I added the sign indexing trick to my ray structure, which got an additional improvement. Here's where things got weird, which I presume is due to the architecture (latest Xeon). After testing various orderings of the exit tests and floating point computations, I took the "no swaps" idea to the logical conclusion, basically expanding out all the possible exit cases, and putting all the exit tests after all the floating point computations. The result was a full 70 0.000000aster than my original code on my scenes. I can only guess that the processor is still working on the floating point stuff when it starts to perform the tests, and somehow benefits from that. Processors are so unpredictable these days. [Look for the Abrash article mentioned elsewhere in this issue. -- Eric]
My code is significantly faster than the fastest pluecker test at http://jgt.akpeters.com/papers/MahovskyWyvill04/, even though I compute the intersection distance as well. I ran the tests on an AMD x64, compiled with Visual C++ 2005, favoring fast code, and fast floating point model:
AABox single precision benchmark: cases = 100000, hitcases = 100000, looping 100 times
fyffe: time = 0.437000s
pluecker:                time = 0.594000s
pluecker_cls:            time = 0.500000s
pluecker_cls_cff:        time = 0.500000s

plueckerint_div:         time = 0.797000s
plueckerint_div_cls:     time = 0.719000s
plueckerint_div_cls_cff: time = 0.718000s
plueckerint_mul:         time = 0.688000s
plueckerint_mul_cls:     time = 0.625000s
plueckerint_mul_cls_cff: time = 0.625000s

standard_div:            time = 0.937000s
standard_mul:            time = 1.079000s

smits_div:               time = 1.109000s
smits_div_cls:           time = 0.969000s
smits_mul:               time = 0.890000s
smits_mul_cls:           time = 0.610000s
Here is my function:
// added to ray.cpp, code at http://jgt.akpeters.com/papers/MahovskyWyvill04/

    r->highIndexX = r->ii < 0.0 ? 0 : 1;
    r->lowIndexX = 1 - r->highIndexX;
    r->highIndexY = r->ij < 0.0 ? 0 : 1;
    r->lowIndexY = 1 - r->highIndexY;
    r->highIndexZ = r->ik < 0.0 ? 0 : 1;
    r->lowIndexZ = 1 - r->highIndexZ;
    r->highIndexX = r->highIndexX * 3 + 0;
    r->lowIndexX = r->lowIndexX * 3 + 0;
    r->highIndexY = r->highIndexY * 3 + 1;
    r->lowIndexY = r->lowIndexY * 3 + 1;
    r->highIndexZ = r->highIndexZ * 3 + 2;
    r->lowIndexZ = r->lowIndexZ * 3 + 2;


// the intersection function

bool fyffe(ray *r, aabox *b, float *t)
{
    float t1x = (((float const *)b)[r->lowIndexX] - r->x) * r->ii;
    float t2x = (((float const *)b)[r->highIndexX] - r->x) * r->ii;
    float t1y = (((float const *)b)[r->lowIndexY] - r->y) * r->ij;
    float t2y = (((float const *)b)[r->highIndexY] - r->y) * r->ij;
    float t1z = (((float const *)b)[r->lowIndexZ] - r->z) * r->ik;
    float t2z = (((float const *)b)[r->highIndexZ] - r->z) * r->ik;
    if (t1x > t2y || t2x < t1y || t1x > t2z || t2x < t1z || t1y > t2z || t2y < t1z) return false;
    if (t2x < 0.0 || t2y < 0.0 || t2z < 0.0) return false;
    // [NOTE] uncomment next line if t stores the ray's current length
    //if (t1x > *t || t1y > *t || t1z > *t) return false;

    // the next four lines are optional, they compute the intersection distance and return it
    float distance = t1x;
    if (t1y > distance) distance = t1y;
    if (t1z > distance) distance = t1z;
    *t = distance;
    return true;
}
I do like the simplicity of it! So does the modern compiler, apparently.
The order of the exit testing did matter, I presume because we want to test the most likely exists first.
I'm using Visual Studio 2005, with "maximize speed", "any suitable" inlining, intrinsic functions enabled, "favor fast code", "precise" floating point model, and SSE2 enabled.
I did try moving the early outs to earlier places, but I found on my tests that if I put any of the tests above any of the floating point stuff, it did get slower. I tried quite a few permutations there. That being said, there might be some permutation that I did not try. Looking at the ASM listing, it looks as if the compiler has decided on its own that some of the early-outs should be placed between the various floating point operations. I don't think it's actually doing any SSE2 code though. Maybe the Intel compiler would do even better.
[On a related note, I found the follow paper pretty clever: Kensler, Andrew, and Peter Shirley. "Optimizing Ray-Triangle Intersection via Automated Search," Proceedings of the 2006 IEEE Symposium on Interactive Ray Tracing, pp. 33-38, September, 2006. http://www.cs.utah.edu/~aek/research/triangle.pdf - the idea is to improve speed by having the computer reorder the code in various ways and test these. -- Eric]
(followup here)
back to
contents
It turns out I’m not the only one that believes degrees are useful:
Like every other issue under the nerd sun, this one was debated on Slashdot, and (as usual) most people missed the point http://developers.slashdot.org/article.pl?sid=04/08/28/1941209. One thing I liked (though I disagree that it doesn’t matter if no one sees it) was this comment:
    Sure, you can use a calculator to translate to and from your favorite
    angle units, but it doesn't lend itself to readable code. As a user,
    I'd rather see "90" than "1.5707963267948499". The point is moot if no
    user is ever going to look at or edit the model directly with a text
    editor, but if there's some possibility that they might, why make it
    hard for no reason?

    That is, if you write out an XML file with angles, would you prefer
    "angle=1.5707963267948499" or "angle=90"?

    XML is supposed to be human readable and editable (and debuggable), by
    hand if need be; it’s one of the reasons we pay the price of a bulky
    string-based file format vs. a binary format.
back to
contents
From Thatcher Ulrich:
Have you tried Marsaglia's complementary-multiply-with-carry (the code is very short; I have a version at http://tu-testbed.svn.sourceforge.net/viewvc/tu-testbed/trunk/tu-testbed/base/tu_random.cpp?view=markup)
All seeds other than 0 seem to work well, and the data is a lot smaller than MT unless you need hugely long periods, so maybe it meets your needs.
I also just came across this Marsaglia article that I hadn't seen before: http://www.jstatsoft.org/v08/i14/xorshift.pdf but I don't have experience with it.
John Stone replies:
I've been playing with Marsaglia's KISS RNG which is a combination of the MWC RNG and two other RNGs. I've been pretty happy with that one so far. It does reasonably well on the statistics tests and runs pretty fast. I haven't tried MWC by itself, as I focused on RNGs that had a bit longer period and better stats. The xorshift RNGs are quite interesting, particularly for use on GPUs since GPUs can do bit shift operations inexpensively but don't like to do full 32-bit integer multiplies (at least on present-day hardware). I haven't gotten very far on checking into the really recent xorshift RNGs that supposedly have statistics about as good as MT based on L'Ecuyer's testing. I want to take some of the better RNGs from L'Ecuyer's TESTU01 suite and try implementing them on both GPUs and for multithreaded implementation on CPUs and see how they do. I just haven't had time to work on it yet.
Thatcher responds:
Pretty interesting, thanks for the L'Ecuyer pointer. I grabbed TestU01 and looked in there; I don't see the generator I mentioned ("Complimentary multiply-with-carry" from George Marsaglia, "Seeds for Random Number Generators", Communications of the ACM, May 2003, Vol 46 No 5, pp90-93). I plugged it into TestU01 and it passes L'Ecuyer's SmallCrush and Crush batteries (BigCrush is still running). I used the 8-seed version with period ~= 2^285. Timing-wise it's slightly slower than KISS99 on my machine (it has only one 32x32->64 multiply, but has a conditional and a bigger state table).
I don't know if that is relevant to you. Complementary multiply-with-carry seems a little obscure for some reason but it seems to have very good properties.
I asked John for any final followup. He replied:
The main observation that I've had recently is simply that it would be very nice to have a toolbox of RNGs that work well on GPU architectures, i.e. many-core architectures where the stack doesn't exist, local/cache memories are very small (KBytes at most) and most of one's active data lives in registers. My previous commentary about the excessive resources used by some of the traditionally popular high-quality RNGs goes doubly so in the case of GPUs and similar many-core architectures. Some of the simpler RNGs that were mentioned in the previous RTNews article and subsequent discussions are viable for GPUs. That said, one often needs to create parallel random number streams that are uncorrelated, and that looks to be much harder to do well for the RNGs I'm familiar with, particularly at the scale one needs if one wants a separate RNG per-thread on a GPU-like many-core architecture that schedules tens of thousands of threads concurrently. RNGs can end up being a bottleneck for Monte Carlo algorithms on architectures like GPUs, if they reduce available parallelism or create the necessity to perform frequent reductions or other operations involving warp-wide or thread-block-wide synchronization.
I would love to see someone do some significant exploration in the implementation of high quality RNGs on GPUs. Particularly interesting is to find RNGs with a decent period, small state vector, and the ability to generated uncorrelated streams, all within the confines of a single thread such that the RNG can be used in thousands of independent threads of execution. This would have lots of uses in graphics and ray tracing in particular, but also for lots of scientific computing applications as well.
back to
contents
This thought was reinforced recently when I had a particularly difficult problem involving ray tracing. It was not that the problem itself was overly complicated, but that the number of possible causes was overwhelming.
Problems like this occasionally intrude upon my dreams as nightmares, but the dream I experienced while waking up from a restless night was particularly vivid.
I dreamt I was standing on a mountaintop overlooking a desert. It was sunny and brutally hot, I was wearing nothing but an itchy robe (the housecoat I usually wear after taking a shower), and my bare feet were sore from standing on the hot rocks. Worse, my arms were sore from holding this block of stone in the shape of an open book.
Yes, I know, Moses and all that ... after five decades, I was dreaming about my Sunday school lessons from the Bible. I even recognized this in my dream and was about to tell myself to wake up when I realized that there was C++ source code on the stone (hey, it was my dream), and that one line was burning. A thundering voice shouted "Badouel!!!," which woke me up.
Ten minutes later I was holding my heavy 800+ page copy of Graphics Gems, looking at the page with Didier Badouel’s pseudocode for his ray-triangle intersection algorithm ("An Efficient Ray-Polygon Intersection"). And there on the right-hand page, right where I saw it in my dream, was the line of code that was causing the problem in my program.
I had not looked at Badouel’s algorithm in this book since 1993. Fifteen years ago!
One hour later, my problem was solved, and I had a new explanation for sleeping at my desk: "Let me tell you a story..."
back to
contents